Chapter 6 | 5 min read
Gann Theory
In the complex world of trading, predicting market movements with any degree of accuracy can be at best very difficult. But while many traders depend upon traditional tools such as trendlines and moving averages to base their trading decisions upon, others seek out ways in which time, price, and geometry may interact to predict future market action.
Gann Theory, developed by W.D. Gann, is one very unique approach that combines elements of these into a single predictive framework. But just how does Gann Theory work, and can the method really improve trading decisions?
The Gann Theory is a trading technique named after the person who developed it-William Delbert Gann-it works out geometry, time cycles, and historical data to predict future movements.
Gann was an early 20th-century mythical legend among traders who bragged about developing a certain system that could accurately project with mathematical certainty the exact movements of prices. His techniques, though considered complex in nature and esoteric for study, have intrigued the world of traders for quite some time.
Core Ideas of Gann Theory
Reference of Gann Angle
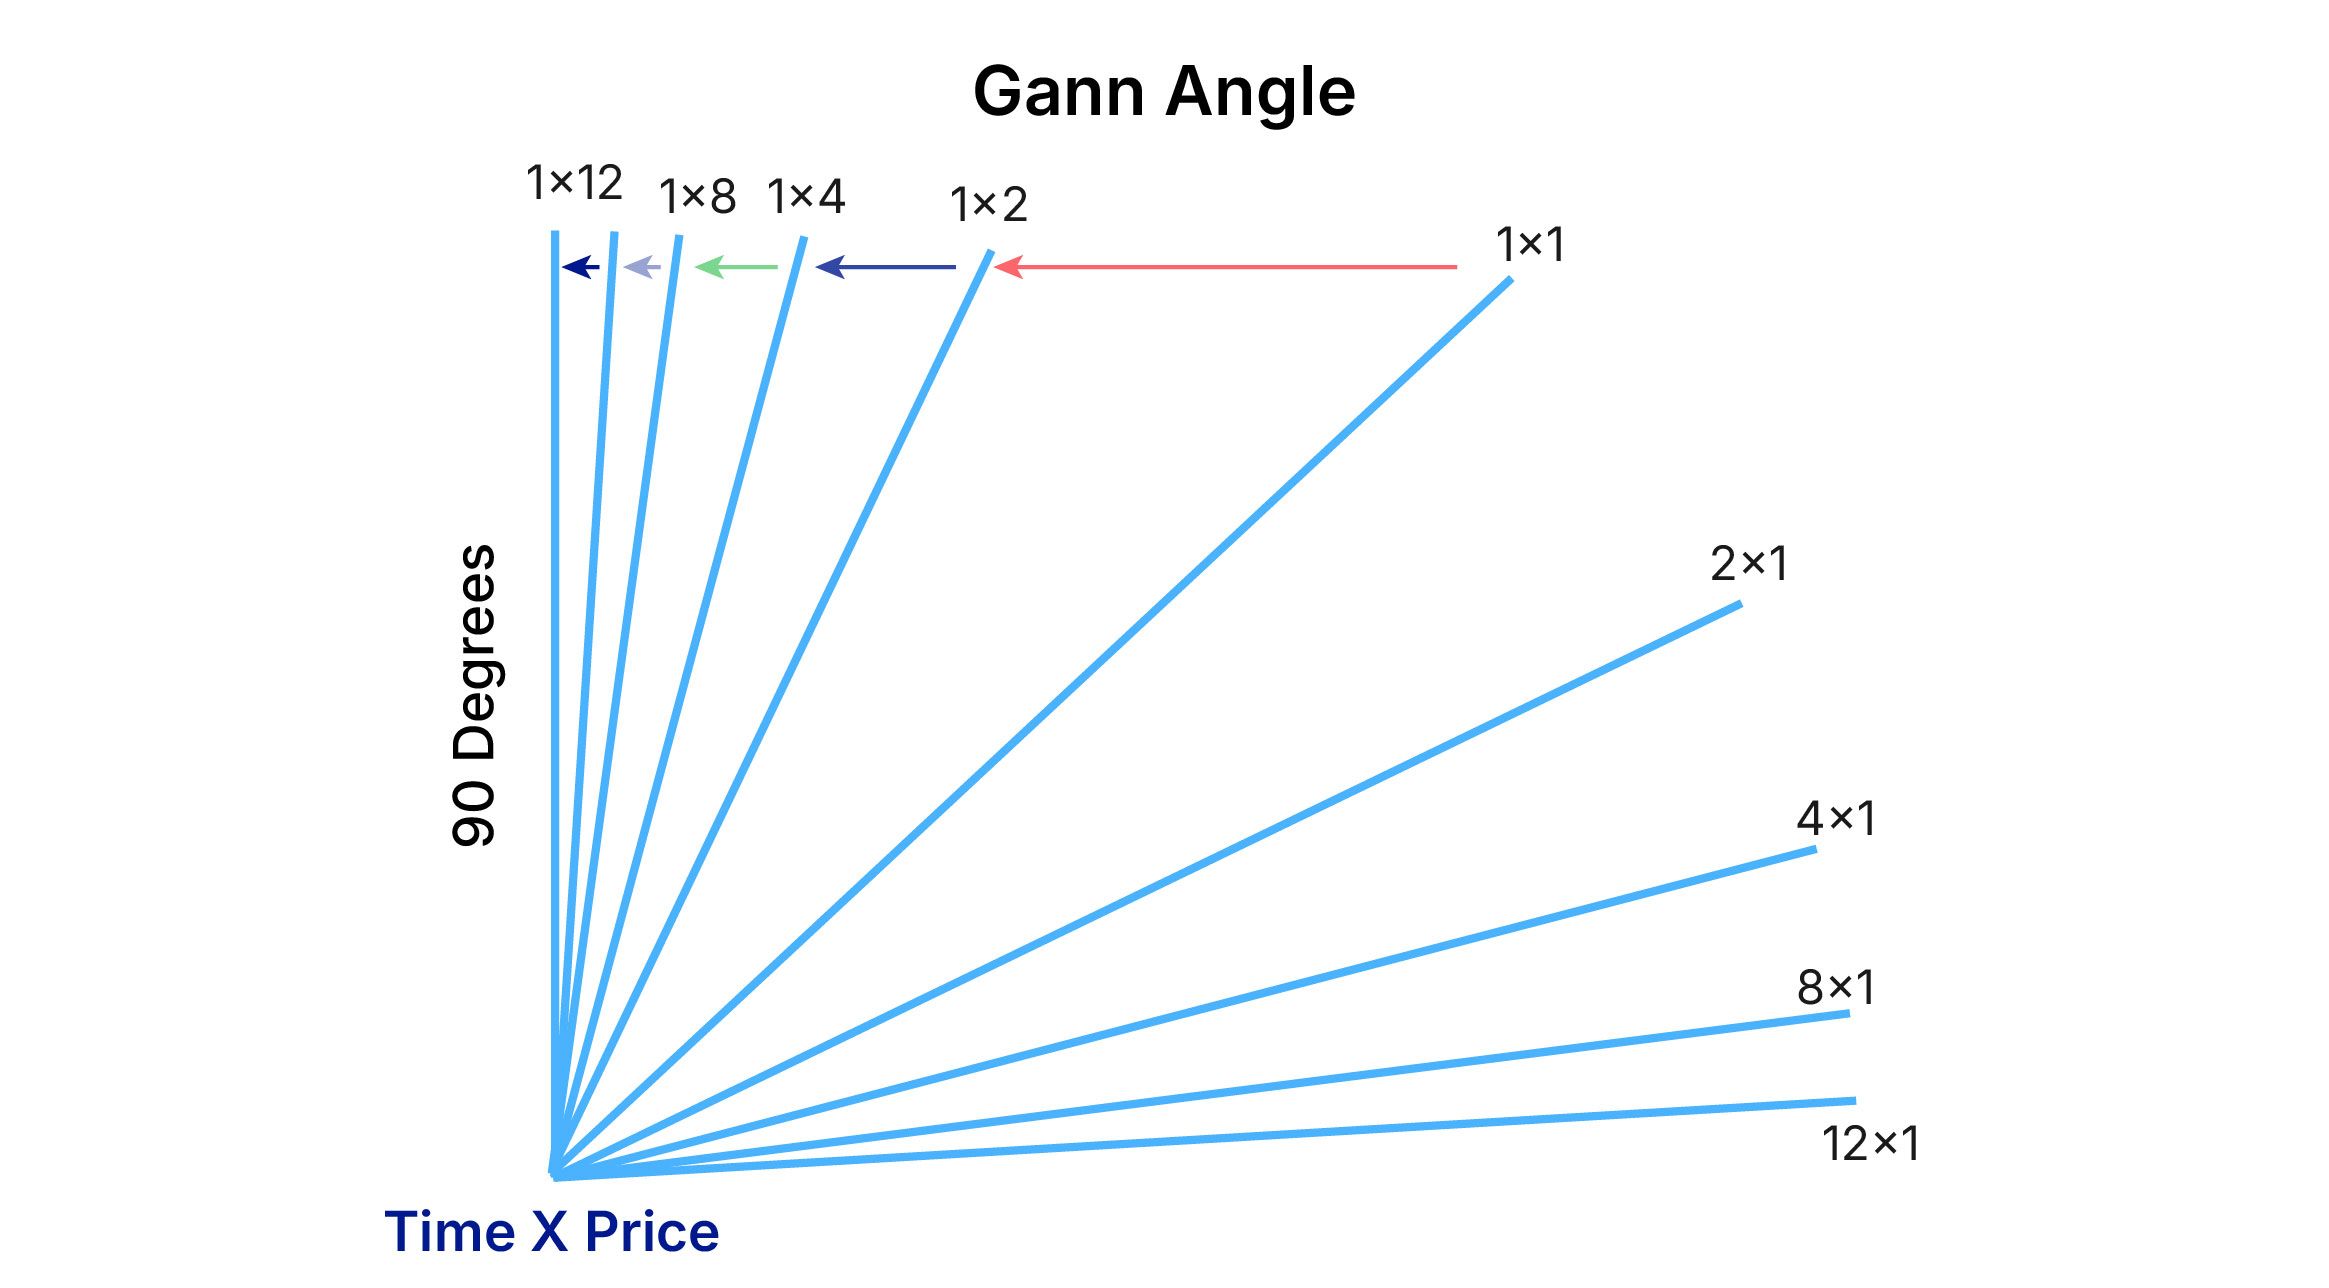
1. Gann Angles
Definition: Gann Angle refers to a set of diagonals that are drawn on charts of price, showing, in a series, the rate of ascent or descent using various angles. Of this, the most important or significant angle is the 1x1 angle, whose slope is 45 degrees. Gann believed his angles could predict key resistance and support levels in the marketplace.
How to Use Gann Angles: In order to draw Gann angles, a considerable high is decided or low is achieved on the chart; based on it, the angular lines are drawn at variant angles 1x1, 2x1, 3x1, etc.--which forecast the future motions of the price.
Example: Assume Tata Motors has been steadily rising from ₹100 to ₹200. Drawing a 1x1 Gann Angle from the low of ₹100 will give you the potential support levels. If the price retraces to the 1x1 angle and sustains there, that could be a strong support.
Reference of Gann Square of Nine
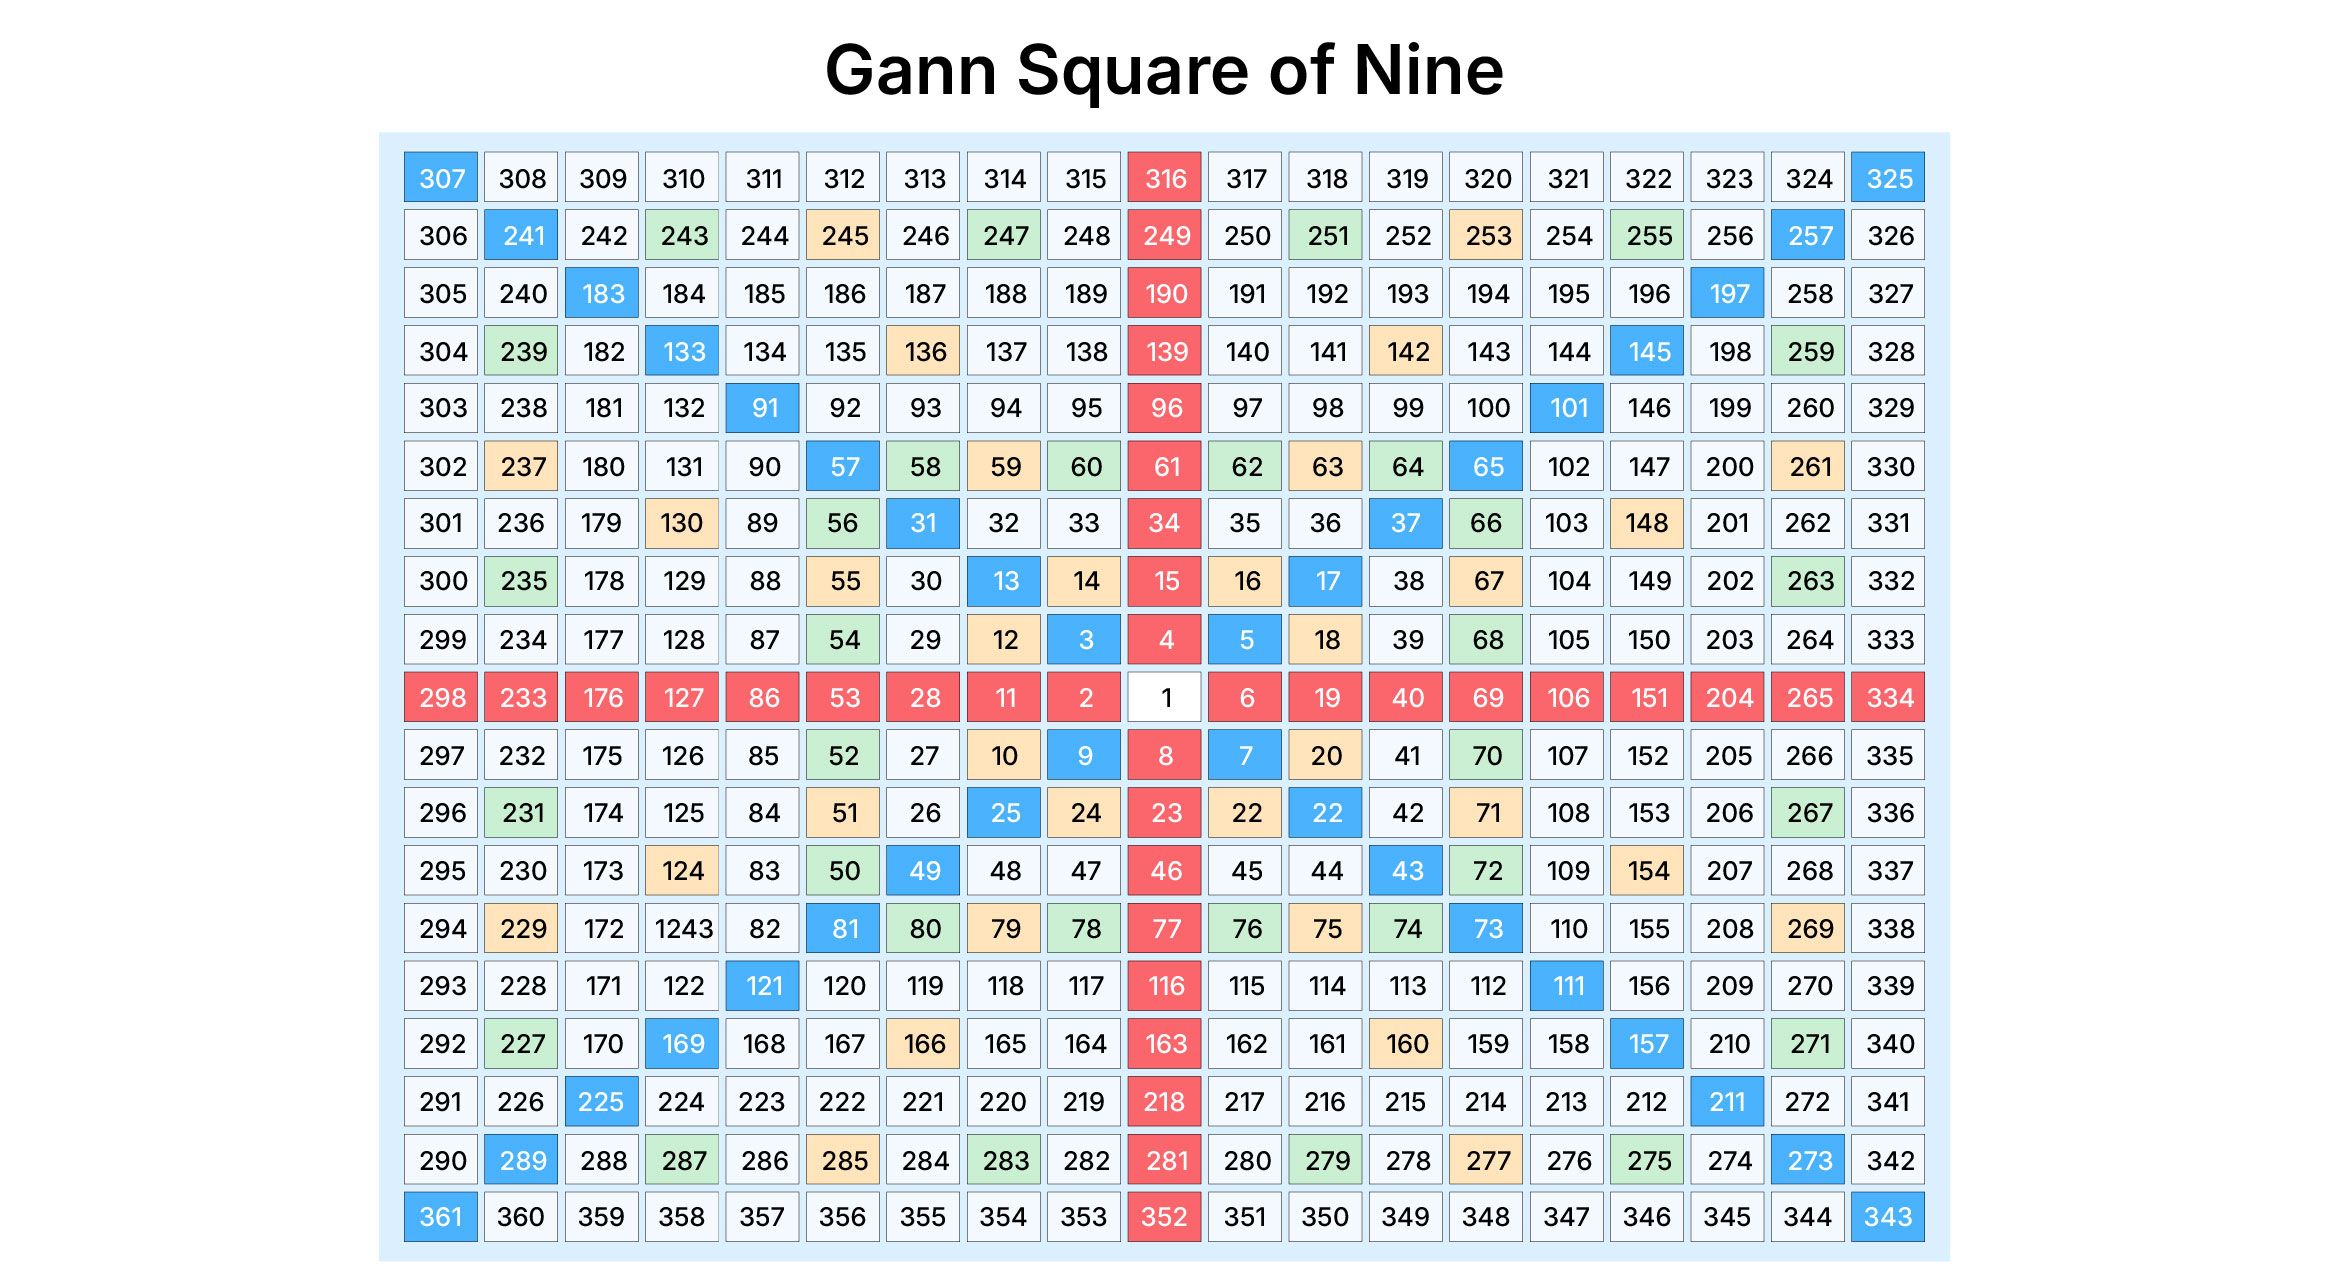
2. Square of Nine
Definition: A mathematical tool employed by Gann to derive various price levels out of a spiral of numbers, this chart has been used as a way of highlighting many important price levels from where market reversals have originated.
How the Square of Nine can be used: The Square of Nine is employed by finding the price of the asset on the grid and finding the corresponding angle in the square that will provide levels where the market might find a reverse or support/resistance.
Example: If Reliance Industries is trading at ₹1,500 and you find this level in the Square of Nine, the angles corresponding to that may indicate that the next resistance level is around ₹1,600 and the next support level is around ₹1,400.
Reference of Time Cycle of Gann Theory
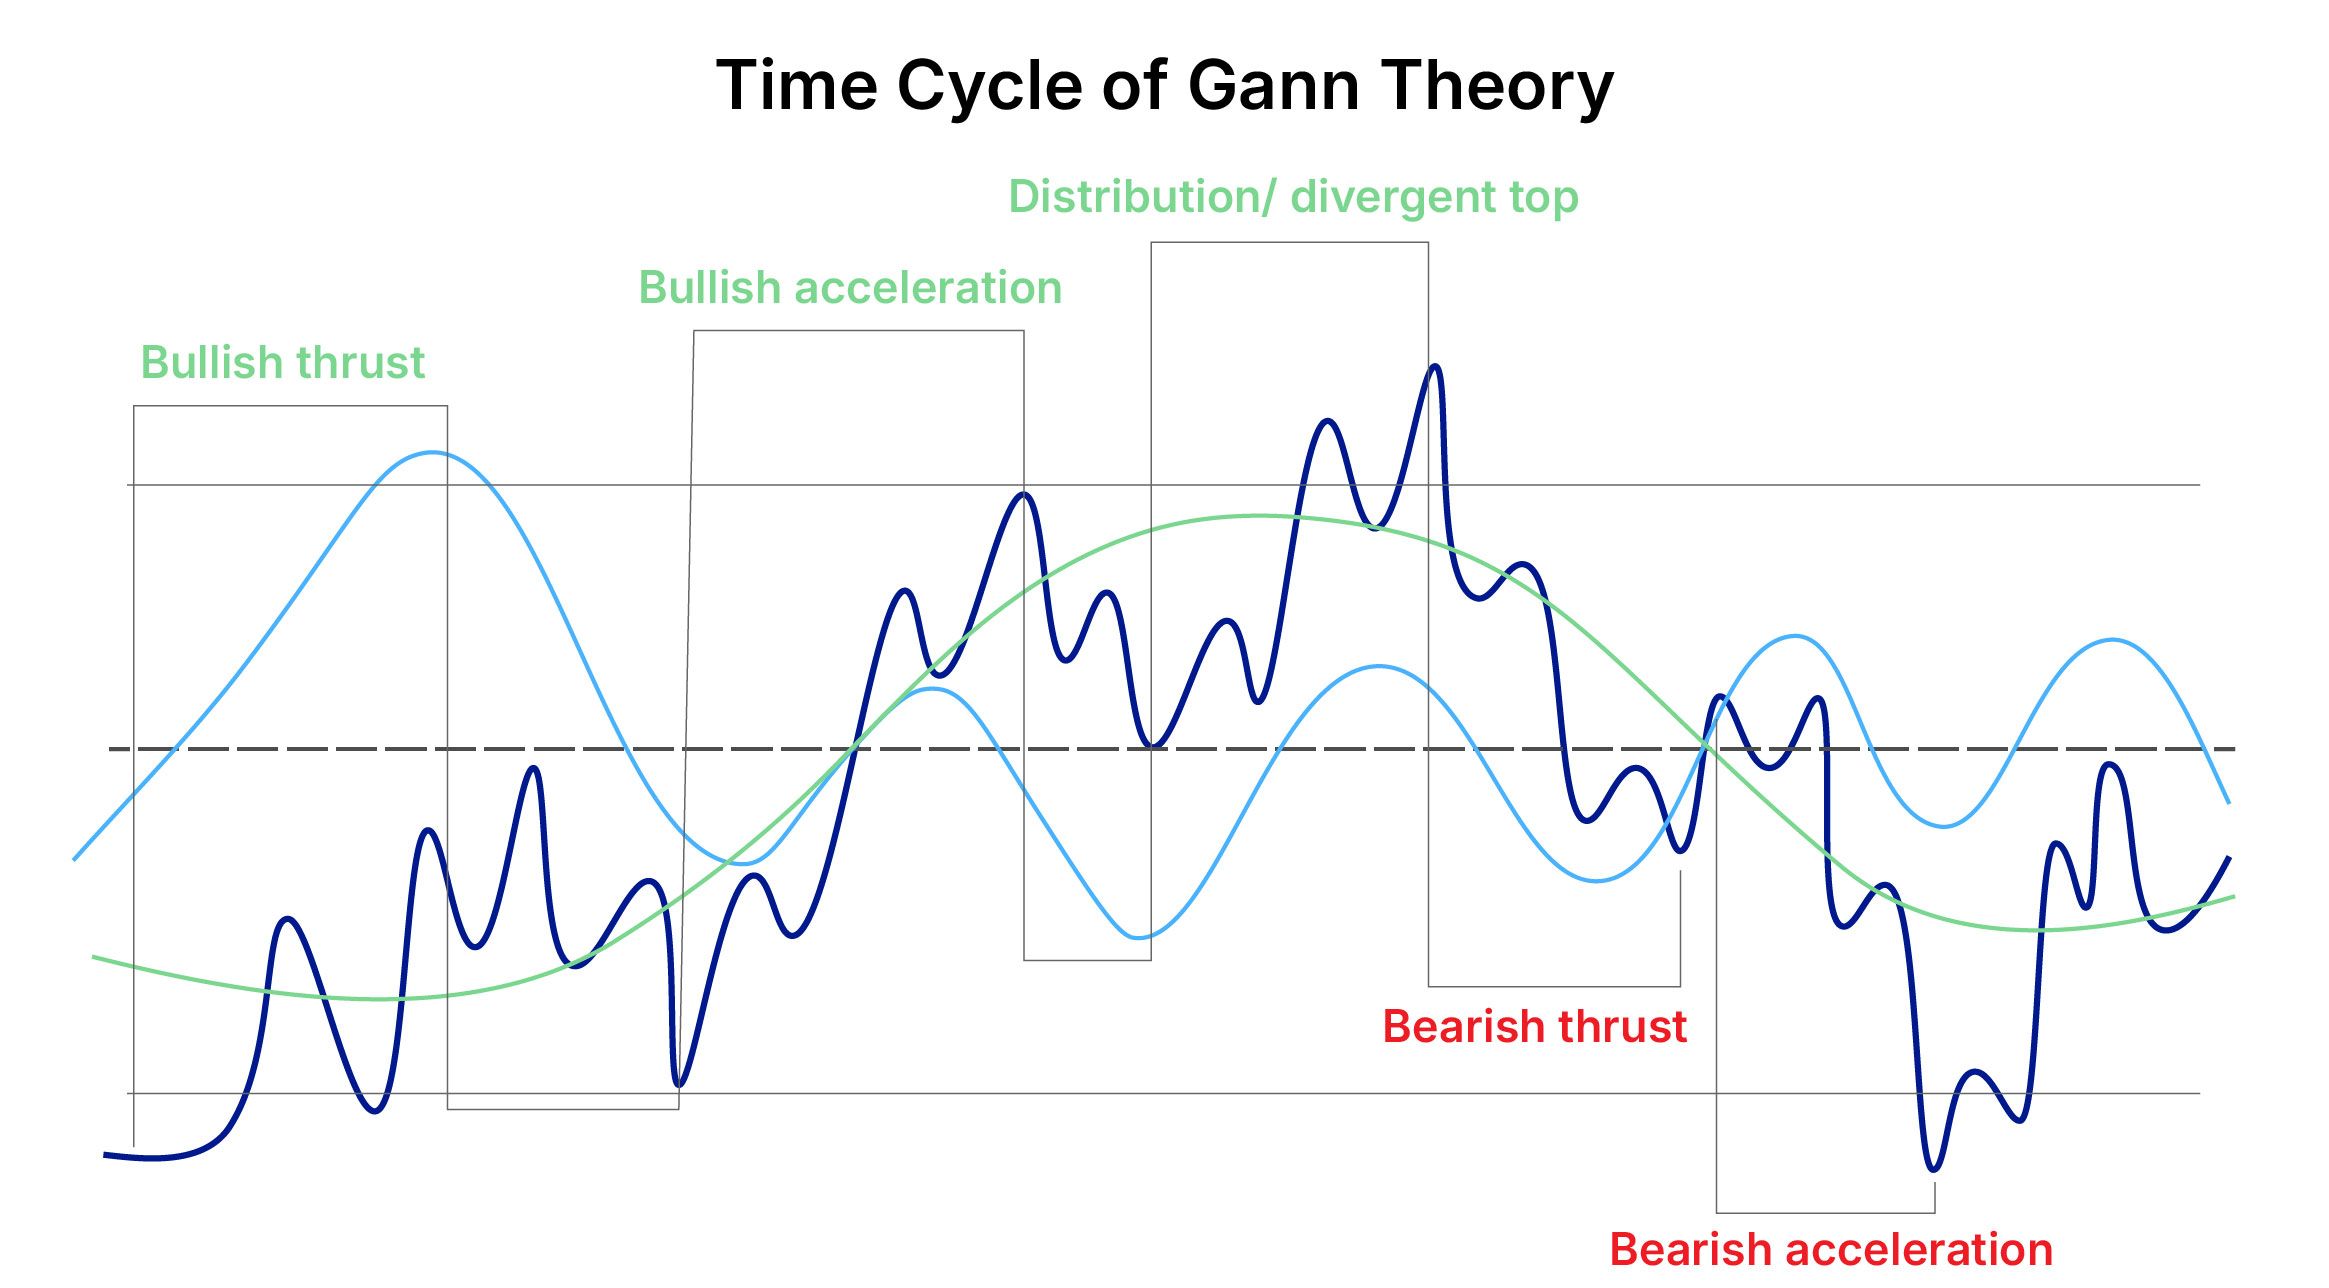
3. Time Cycles
Definition: Gann regarded time as a vital dimension in market analysis and held that the market moved in cycles, which were predictable. These may be based on any time frame, which include days, weeks, months, or even years.
How to Use Time Cycles: This maps time cycles by identifying significant past turning points and measures the time elapsing between them; these are then projected forward in time to predict probable future market reversals.
Example: If, say, HDFC Bank has always shown major moves within 90 days, then the trader, through Gann Theory, could expect another reversal or major move 90 days from the last turning point.
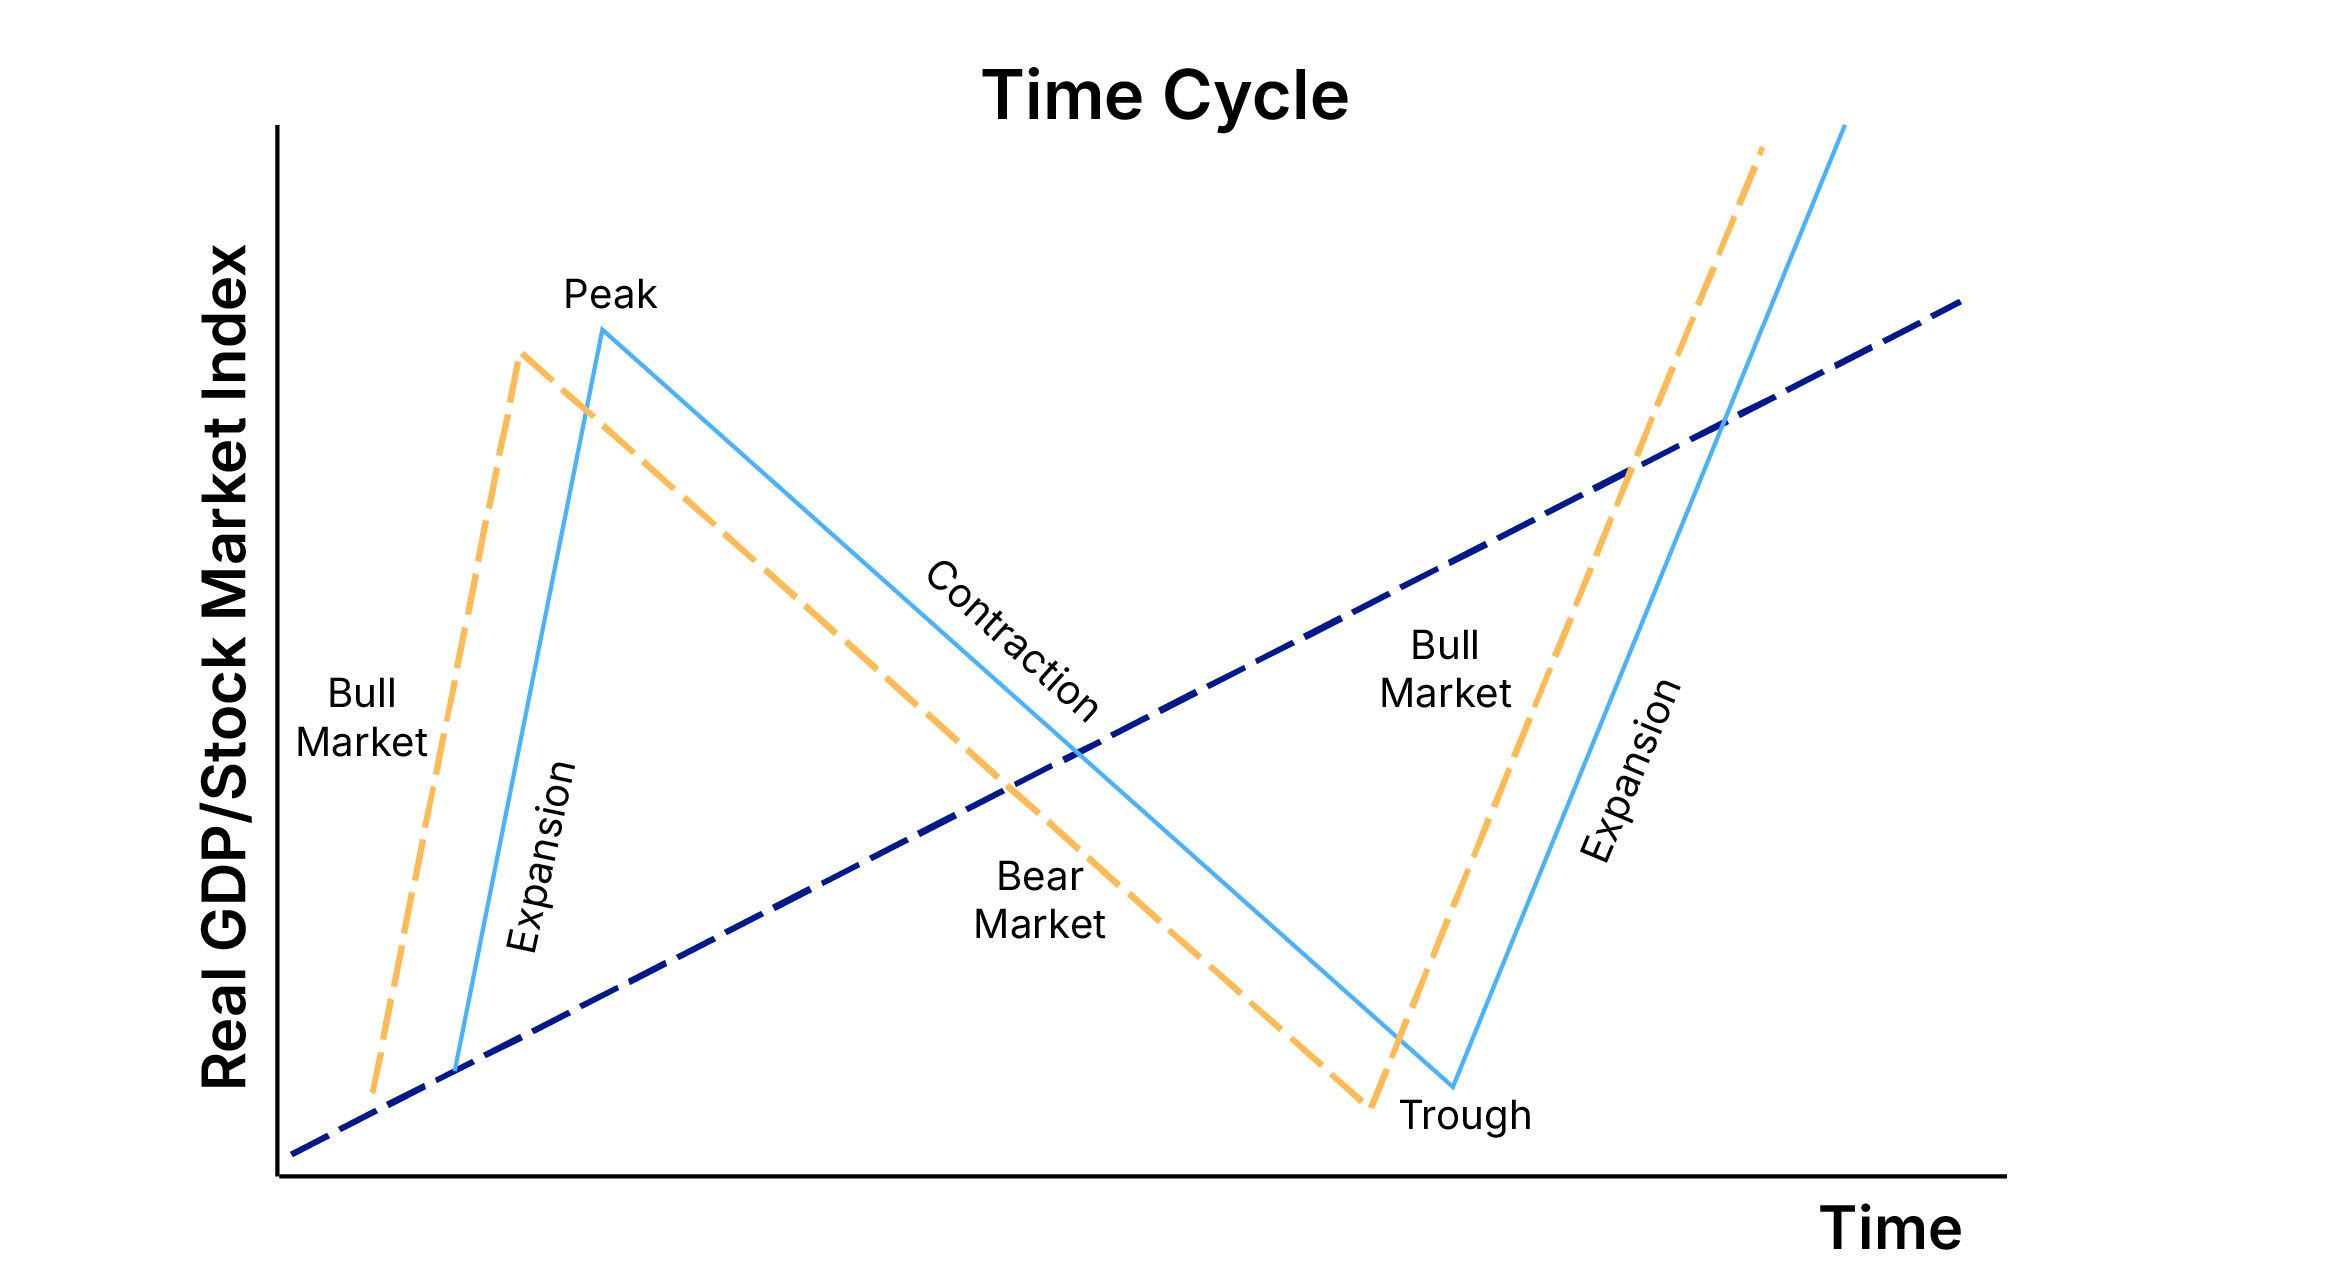
Reference of Time Cycle
The Gann theory remains complex, but if put into practice correctly, it proves to be very powerful. Here are some ways traders can apply Gann's methods into their trading strategies:
Identification of key levels by Gann angles: The Gann Angles give the levels of substantial support and resistance to traders. In case the price respects one angle-for example, a bounce off a 1x1 angle-then this might be a very strong indication for entry or exit of the trade.
Example: If Infosys respecting the 2x1 Gann Angle on pullback that has given a very strong buying opportunity, indicating uptrend continuation.
Using the Square of Nine for Price Targets The Square of Nine can also be used in projecting price targets and potential reversal points. In forecasting, a trader is able to approximate where the price might find resistance or support by simply matching angles on the Square of Nine to the current price.
Example: In the instance that if the ICICI Bank is quoting around ₹ 500 then its Square of Nine says that ₹ 520 is one major resistance, a trader may use the same for either target or reversal levels.
Timing the Market with Time Cycles: Gann's time cycles are helpful in making predictions about the most probable dates of major market movements by identifying repeated patterns in the timing of market tops and bottoms.
Example: If TCS has been experiencing a cycle of big price movements every 120 days, a trader might position himself for a similar movement as the next 120-day cycle approaches.
While Gann Theory brings one of the most distinctive viewpoints into market analysis, it does come with a host of challenges.
- Complex: The methods of Gann include complex processes that are rooted in mathematics, geometry, and the dynamics of market movement; this may be quite challenging to use for a novice trader.
- Subjectivity: Gann Angles, the Square of Nine, and time cycles are often subjective; hence, two different traders could have completely different conclusions when viewing the same set of data.
- Market Conditions: Gann Theory works impeccably in trending markets, while in a choppy/sideways market, they are less effective.
In conclusion, Gann Theory gives a confluence of price, time, and geometry to yield a very unique set of tools to predict market turning points. Though complex, often contradictory, and arguable in nature, any methodology holds its merits-which shall be reflected later-if appropriately applied.
Its principles enable traders to benefit from such concepts as finding turning points and key market levels through Gann Angles, the Square of Nine, and time cycles. As you continue building up your trading strategy, incorporating Gann Theory into other technical analysis tools will really help you move with precision in the markets. In the next chapter, Volume Analysis. The Key to Understanding Market Strength will help traders determine the validity of price movements through an analysis of trading volume and its relationship to price action.
Recommended Courses for you


Learn, Invest, and Grow with Kotak Videos
Explore our comprehensive video library that blends expert market insights with Kotak's innovative financial solutions to support your goals.

Trading with collateral as margin with Kotak Neo

How India is Redefining Space Exploration

