Chapter 1 | 5 min read
ADX (Average Directional Index) Measuring the Strength of a Trend
The Average Directional Index (ADX) is a popular technical indicator used to measure the strength of a trend, whether the market is moving up, down, or sideways. Unlike other indicators that determine the direction of a trend, the ADX focuses solely on how strong the trend is, helping traders decide whether they should enter, hold, or exit a trade based on the momentum of the market.
Developed by J. Welles Wilder, the ADX is particularly useful for identifying strong trends that are likely to continue, as well as weak trends that may reverse or enter a consolidation phase.
In this article, we’ll explore how the ADX works, how it’s calculated, and how traders can use it to make informed trading decisions.
What Is the ADX?
The Average Directional Index (ADX) is a trend-strength indicator that ranges from 0 to 100. It is part of the Directional Movement System, which also includes the +DI (Positive Directional Indicator) and –DI (Negative Directional Indicator). Together, these three components help traders assess both the direction and strength of a trend.
- ADX: Measures the strength of a trend.
- +DI: Measures the strength of upward price movement.
- DI: Measures the strength of downward price movement.
The ADX itself does not tell traders whether the trend is bullish or bearish; instead, it simply shows how strong the current trend is.
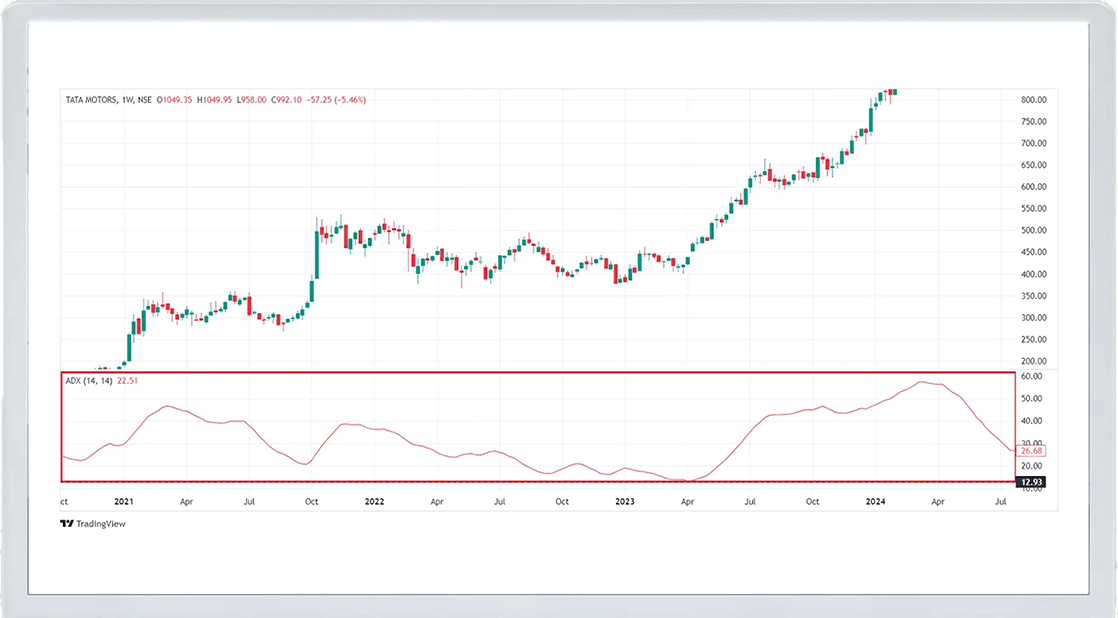
Image Courtesy: Tradingview
How to Interpret the ADX
The ADX provides a numeric value that indicates the strength of the trend. The higher the ADX value, the stronger the trend. Here's a basic guideline for interpreting ADX values:
-
0-20: Indicates a weak trend or a market in consolidation. Prices are likely moving sideways, and there is little momentum in the market.
-
20-40: Indicates a moderate trend. This is often considered the threshold for a trend to be considered actionable. If the ADX is rising within this range, it suggests that the trend is gaining strength.
-
40-60: Signals have a strong trend. Whether the market is going up or down, a rising ADX within this range indicates a powerful trend that traders may want to follow.
-
60-100: Reflects an extremely strong trend, which could mean the trend is nearing exhaustion or could continue strongly. Traders should be cautious, as high ADX values can sometimes precede reversals.
How to Calculate ADX
The ADX is calculated using a multi-step process, which involves smoothing the data over a specific number of periods (typically 14). The key components of the ADX calculation are the +DI and -DI values, which measure the strength of the upward and downward movements.
Here’s a simplified breakdown of the steps:
- Calculate the +DI and -DI values: These are calculated by comparing the current high and low prices to the previous high and low prices.
- Calculate the Directional Movement Index (DX): The DX is calculated as the absolute difference between +DI and -DI, divided by their sum, and then multiplied by 100.
- Smooth the DX: Finally, the ADX is calculated by smoothing the DX values over a specified number of periods, typically 14.
While the math can be complex, most trading platforms automatically calculate the ADX, making it easy for traders to interpret.
How Traders Use the ADX
The ADX is a versatile indicator that traders can use in several ways to improve their trading strategies. Below are some of the most common uses of the ADX:
1. Identifying Strong and Weak Trends
One of the primary uses of the ADX is to identify whether the market is in a strong trend or a weak trend. Traders can adjust their strategies accordingly:
- If the ADX is above 20, it indicates that a trend is developing, and traders might want to consider following the trend.
- If the ADX is below 20, it signals that the market is range-bound or moving sideways, and trend-following strategies may not be effective.
2. Confirming Trade Signals
Traders often use the ADX to confirm signals generated by other technical indicators, such as Moving Averages or RSI:
- For example, if a trader receives a buy signal from a Moving Average crossover and the ADX is rising above 20, this could confirm that the new uptrend is gaining strength.
- Conversely, if a sell signal appears and the ADX is falling, it may indicate that the trend is weakening, and the trade may not be as profitable.
3. Using +DI and -DI for Directional Signals
The ADX works alongside the +DI and -DI lines to help traders determine the direction of the trend:
- When the +DI line crosses above the -DI line, it signals a bullish trend.
- When the -DI line crosses above the +DI line, it signals a bearish trend.
Traders often look for these crossovers, combined with a rising ADX, to identify potential entry or exit points.
Example: Using ADX in Infosys
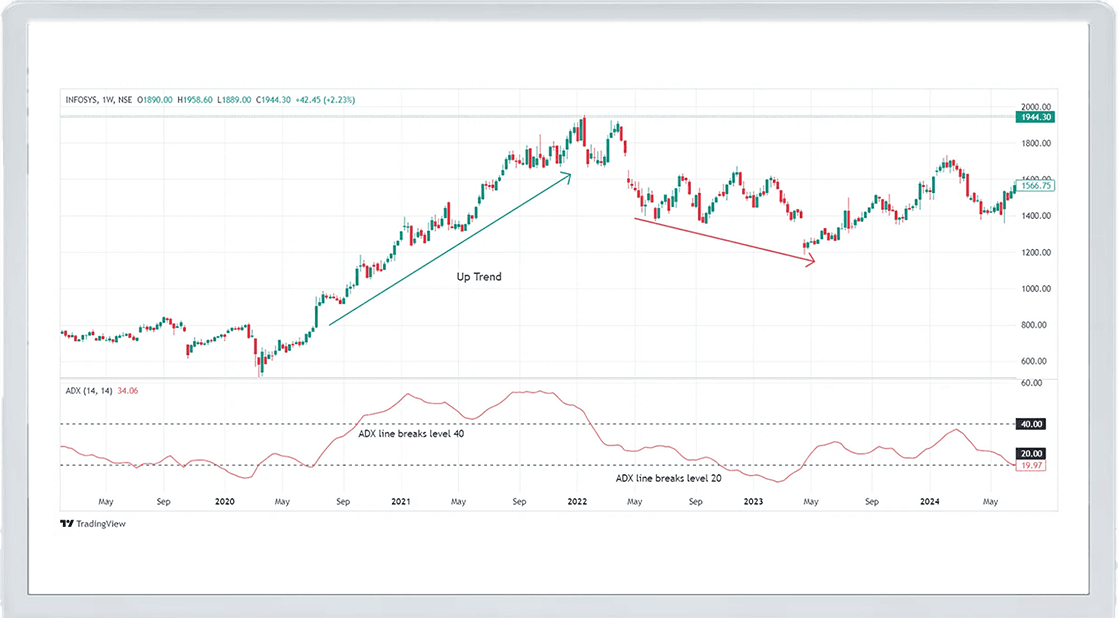
Image Courtesy: Tradingview
Let’s say Infosys has been in a steady uptrend, but the ADX value starts to rise above 40, signalling a strong trend. At the same time, the +DI is above the -DI, confirming that the bullish trend is intact. A trader might use this information to hold their long position, confident that the trend has enough momentum to continue upward.
However, if the ADX begins to drop below 20 while the price continues to rise, it might indicate that the trend is losing strength, prompting the trader to consider exiting the position.
Adjusting ADX Settings for Different Strategies
The default setting for the ADX is a 14-period calculation, but traders can adjust this setting based on their trading style:
- Short-term traders May use a shorter period (such as 7 or 9) for quicker signals. However, shorter periods can lead to more false signals, as they are more sensitive to price movements.
- Long-term traders May prefer a longer period (such as 20 or 25) to smooth out the data and get a clearer picture of the overall trend. This setting is better suited for trend-following strategies.
Common Mistakes to Avoid
While the ADX is a powerful tool, it’s important to use it correctly. Here are some common mistakes to avoid:
- Ignoring the Trend Direction: The ADX measures the strength of a trend but does not indicate its direction. Traders should always use the ADX in conjunction with the +DI and -DI lines or other directional indicators.
- Overreliance on High ADX Values: An ADX value above 60 often indicates a very strong trend, but it can also signal that the trend is nearing exhaustion. Traders should be cautious and look for additional confirmation before making trades based on high ADX values.
- Using ADX in Range-Bound Markets: The ADX is less effective in markets with no clear trend. In such cases, traders may want to use oscillators like the RSI to trade within the range rather than relying on trend-following indicators.
Conclusion
The Average Directional Index (ADX) is a valuable tool for traders who want to assess the strength of a trend and make more informed decisions about entering or exiting trades. By understanding how to interpret ADX values and combining them with the +DI and -DI lines, traders can enhance their strategies and trade with greater confidence.
In the next chapter, we will dive into another key momentum indicator: Volume-Based Indicators: OBV (On-Balance Volume)
Recommended Courses for you


Learn, Invest, and Grow with Kotak Videos
Explore our comprehensive video library that blends expert market insights with Kotak's innovative financial solutions to support your goals.

Trading with collateral as margin with Kotak Neo

How India is Redefining Space Exploration

