Chapter 6 | 5 min read
Bollinger Bands
Bollinger Bands are one of the most widely used technical indicators for measuring market volatility and identifying potential breakouts. Created by John Bollinger in the 1980s, this indicator consists of three lines: a middle band (typically a simple moving average) and two outer bands that are placed two standard deviations away from the middle band. These bands expand and contract based on the market’s volatility, giving traders valuable insight into whether a security is overbought, oversold, or consolidating.
In this chapter, we will explore how Bollinger Bands work, how traders interpret them, and how they can be used to develop effective trading strategies.
What Are Bollinger Bands?
Bollinger Bands are a volatility indicator that consists of three main components:
- Middle Band: This is typically a 20-period Simple Moving Average (SMA), which smooths out price data over a given time period.
- Upper Band: This is placed two standard deviations above the middle band.
- Lower Band: This is placed two standard deviations below the middle band.
The distance between the upper and lower bands changes based on the market’s volatility. When volatility is high, the bands widen. When volatility is low, the bands narrow.
Bollinger Bands Formula
The formula for Bollinger Bands is as follows:
Upper Band = SMA + (2 × Standard Deviation) Lower Band = SMA − (2 × Standard Deviation)
The standard deviation measures how spread out prices are from the average price, so when volatility is high, the standard deviation increases, causing the bands to widen.
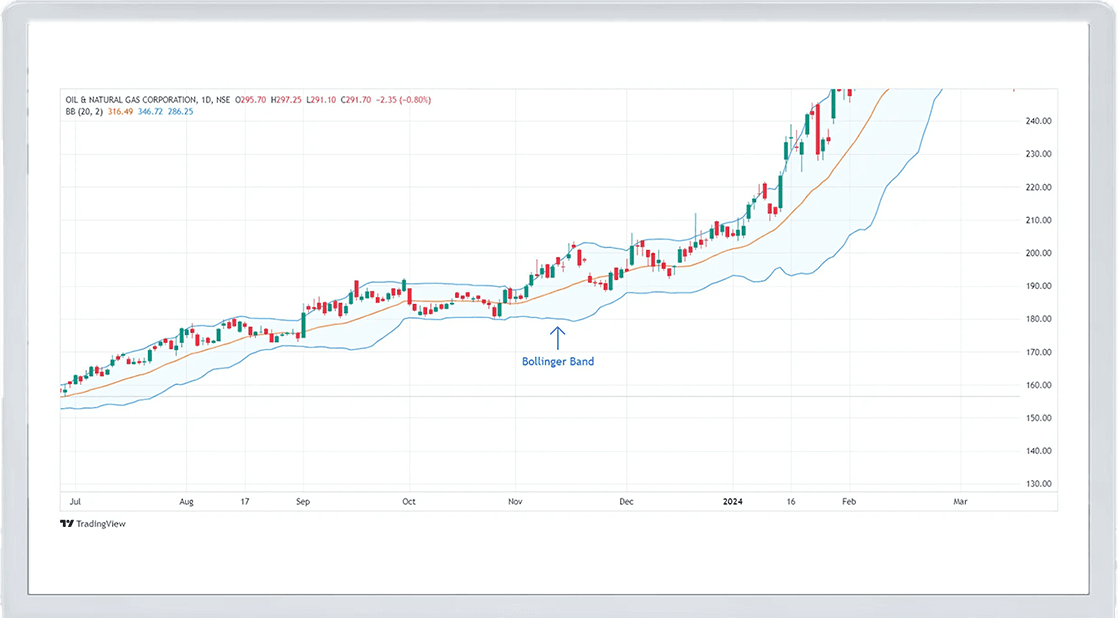
Image Courtesy: Tradingview
How to Interpret Bollinger Bands
Bollinger Bands provide several key signals to help traders make decisions. These signals are typically based on how the price interacts with the bands, and they can indicate potential overbought or oversold conditions, trend reversals, and breakout opportunities.
1. Overbought and Oversold Conditions
-
Overbought: When the price touches or breaks above the upper band, it may indicate that the asset is overbought and could be due for a pullback or correction.
-
Oversold: When the price touches or breaks below the lower band, it suggests that the asset is oversold, and a rebound may be likely.
2. Bollinger Band Squeeze
One of the most important signals Bollinger Bands provide is the squeeze. A squeeze occurs when the bands contract, indicating a period of low volatility. This is often a precursor to a sharp move in price, either upward or downward. When the bands expand after a squeeze, it signals that a breakout is imminent.
Traders watch for the squeeze as a potential signal to prepare for increased volatility and to take action when the price breaks out of the band range.
3. Bollinger Band Breakouts
A breakout occurs when the price moves outside the Bollinger Bands. However, it’s important to note that breakouts are not always signals to buy or sell. Since Bollinger Bands measure volatility rather than direction, a breakout simply indicates increased volatility rather than the direction of the trend. Traders often wait for additional confirmation before entering trades after a breakout.
How Traders Use Bollinger Bands
Traders use Bollinger Bands in various ways to identify trend reversals, entry and exit points, and volatility patterns. Here are some common strategies:
1. Reversion to the Mean
One of the simplest strategies with Bollinger Bands is the concept of reversion to the mean. This assumes that if the price moves too far from the middle band (the 20-period SMA), it is likely to revert back to the mean:
- If the price touches the upper band, traders may look for selling opportunities, expecting the price to fall back toward the middle band.
- If the price touches the lower band, traders may look for buying opportunities, expecting the price to rise toward the middle band.
2. Double Bottom Buy Signal
A double-bottom buy signal is a bullish pattern that occurs when the price touches the lower Bollinger Band twice, with a small price rally in between. The second touch of the lower band is usually a sign that the market is ready to reverse upward. Traders often use this pattern to identify buying opportunities in oversold markets.
3. Using Bollinger Bands with Other Indicators
Bollinger Bands are often used in combination with other technical indicators for more accurate signals. Common combinations include:
- RSI (Relative Strength Index): Traders may use the RSI to confirm whether a security is truly overbought or oversold. For example, if the price touches the lower Bollinger Band and the RSI is below 30, this provides stronger confirmation that the asset is oversold and could be due for a rebound.
- MACD (Moving Average Convergence Divergence): Combining Bollinger Bands with the MACD can help traders confirm the direction of a breakout. If the price breaks above the upper band and the MACD shows a bullish crossover, it may signal a strong buying opportunity.
Example: Using Bollinger Bands in Tata Motors
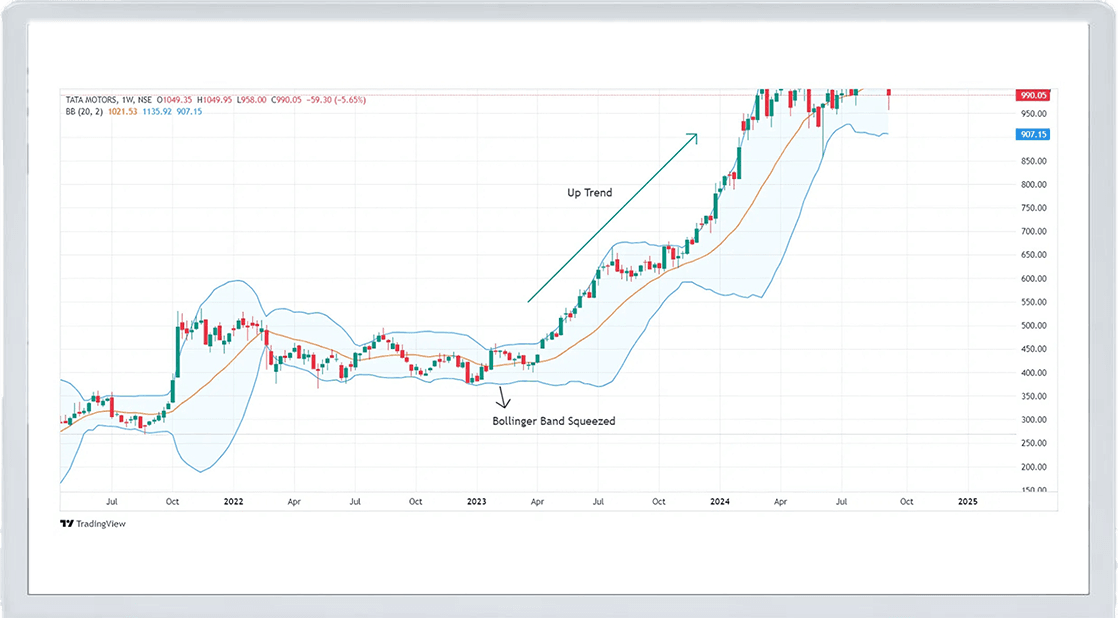
Image Courtesy: Tradingview
Let’s say Tata Motors has been trading in a narrow range for several days, and the Bollinger Bands have started to contract, signalling a squeeze. This contraction suggests that volatility is low, and a breakout could be imminent. After several more days, the price breaks above the upper band, confirming the breakout. Traders might enter a long position, expecting the price to rise sharply following the low-volatility period.
Additionally, if the RSI indicates that the stock is not overbought, this can further confirm the strength of the upward move.
Adjusting Bollinger Band Settings
While the standard setting for Bollinger Bands is a 20-period SMA and two standard deviations, traders can adjust these settings to suit their trading style:
-
Short-term traders may use a shorter period (e.g., 10-period SMA) for more responsive bands that react quickly to price changes.
-
Long-term traders may prefer a longer period (e.g., 50-period SMA) for smoother bands that filter out short-term noise.
Similarly, adjusting the number of standard deviations can make the bands more or less sensitive to price movements. A lower deviation (e.g., 1.5) results in narrower bands, while a higher deviation (e.g., 2.5) creates wider bands.
Common Mistakes to Avoid
While Bollinger Bands are a powerful tool, there are some common mistakes that traders should avoid:
-
Relying on Breakouts Alone: A breakout from the bands does not necessarily signal a trend reversal. It could simply indicate increased volatility. Traders should look for additional confirmation from other indicators or price patterns before entering a trade.
-
Ignoring the Squeeze: Failing to recognise a squeeze can lead to missed opportunities. A squeeze often precedes significant price moves, so traders should be prepared to take advantage of breakouts.
-
Overreacting to Overbought/Oversold Conditions: Just because the price touches the upper or lower band does not mean a reversal is imminent. Traders should use other indicators, like the RSI, to confirm overbought or oversold conditions.
Conclusion
Bollinger Bands are an essential tool for traders looking to understand volatility and identify potential breakouts. By interpreting the bands' expansion and contraction, traders can make more informed decisions about whether the market is consolidating or preparing for a big move. When combined with other indicators like the RSI or MACD, Bollinger Bands offer a comprehensive view of the market’s potential direction.
In the next chapter, we will explore another key technical indicator: MACD (Moving Average Convergence Divergence), which helps traders identify momentum shifts and potential trend reversals.
Recommended Courses for you


Learn, Invest, and Grow with Kotak Videos
Explore our comprehensive video library that blends expert market insights with Kotak's innovative financial solutions to support your goals.

Trading with collateral as margin with Kotak Neo

How India is Redefining Space Exploration

